Supply and Demand
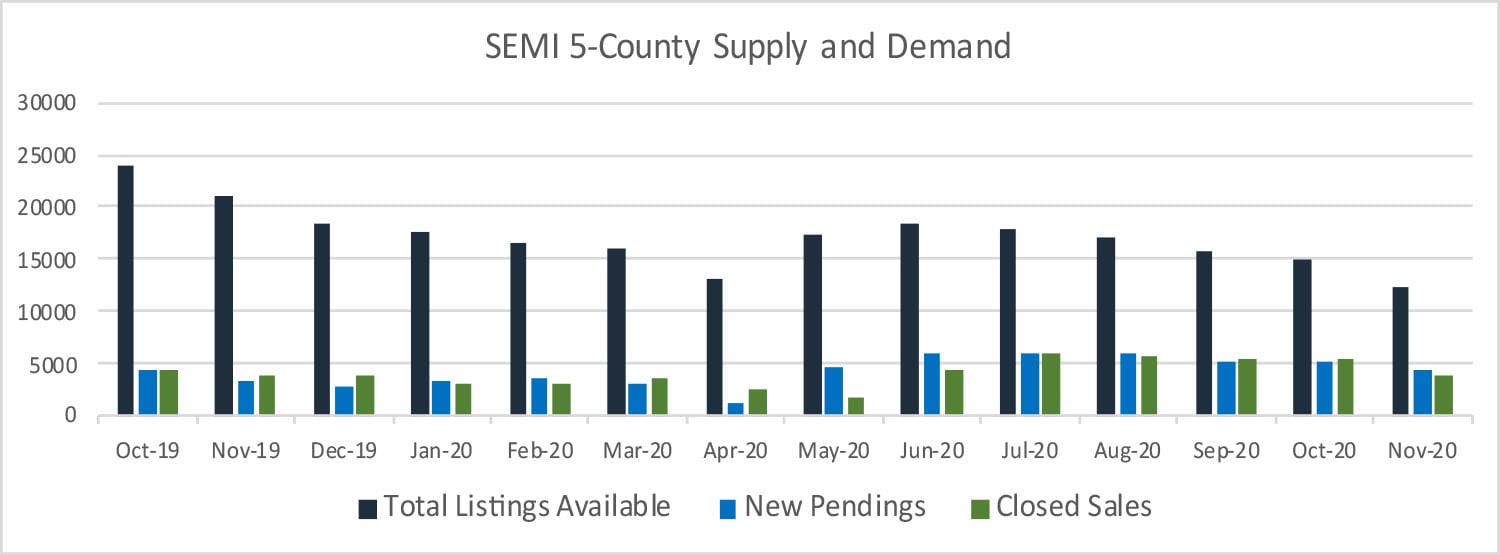
The chart above provides a snapshot of market activity over the past year. Notice how seasonal active listings (red) has dropped compared to prior months while monthly new pendings (blue) and closed sales (green) have been up. Although new pendings are declining seasonally, they are up compared to the same time in prior years. Because of that, we’ll continue to see strong year-end and early 2021 sales compared to previous years—provided inventory holds out. Current inventory is half of what it was 1 year ago.
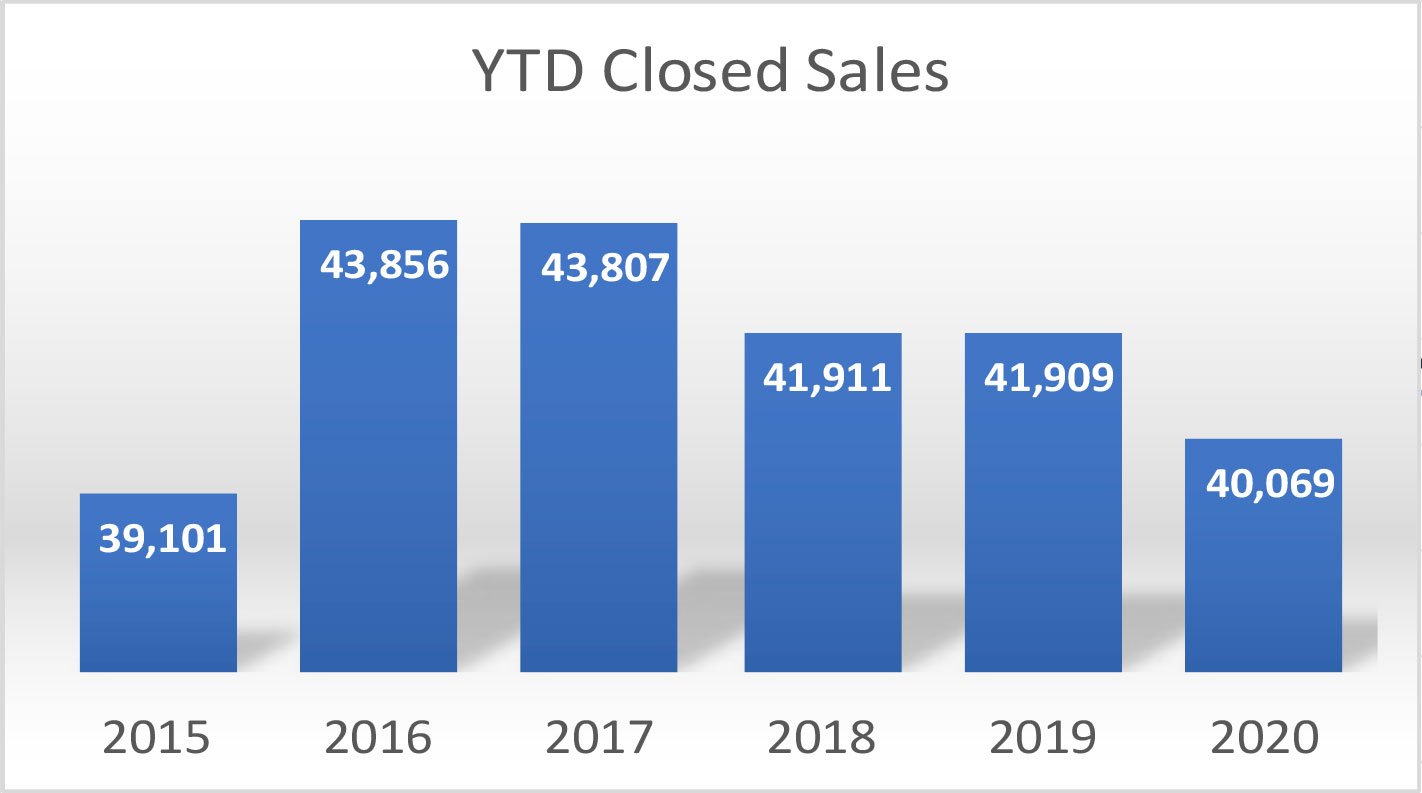
YTD Closed Sales
Despite a 45-day market shutdown this past spring, YTD closed sales are down by just 4% compared to the prior two years. With monthly closed pendings running higher than previous years, expect that shortfall to narrow. With continued strong demand, this year’s closed sales should catch recent prior years so long as there’s enough inventory to support those sales.
Prices and Values
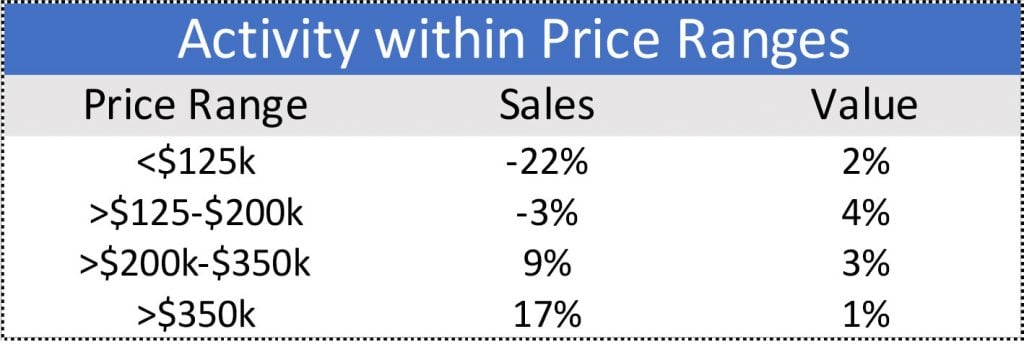
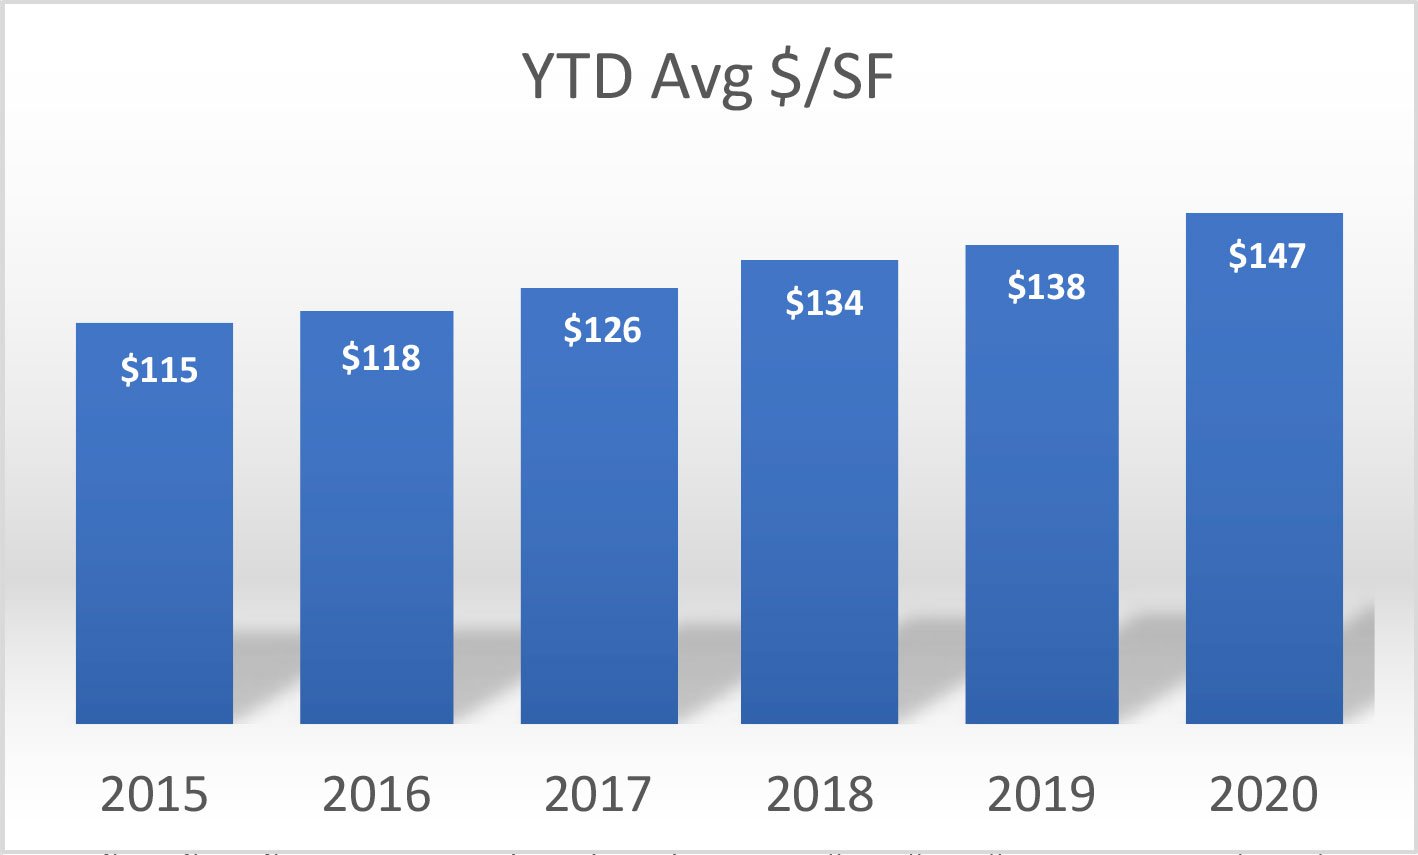
Values are up with YTD average price up 9% and price per square foot up 7%. As seen in the bottom table, however, most of those average increases were due to the 17% increase in over-$350k sales while the number of under-$125k sales dropped 22%. When looking within the price ranges, we see that YTD values of over-$350k properties increased just 1%, and all other price ranges were between 2% and 4%.