

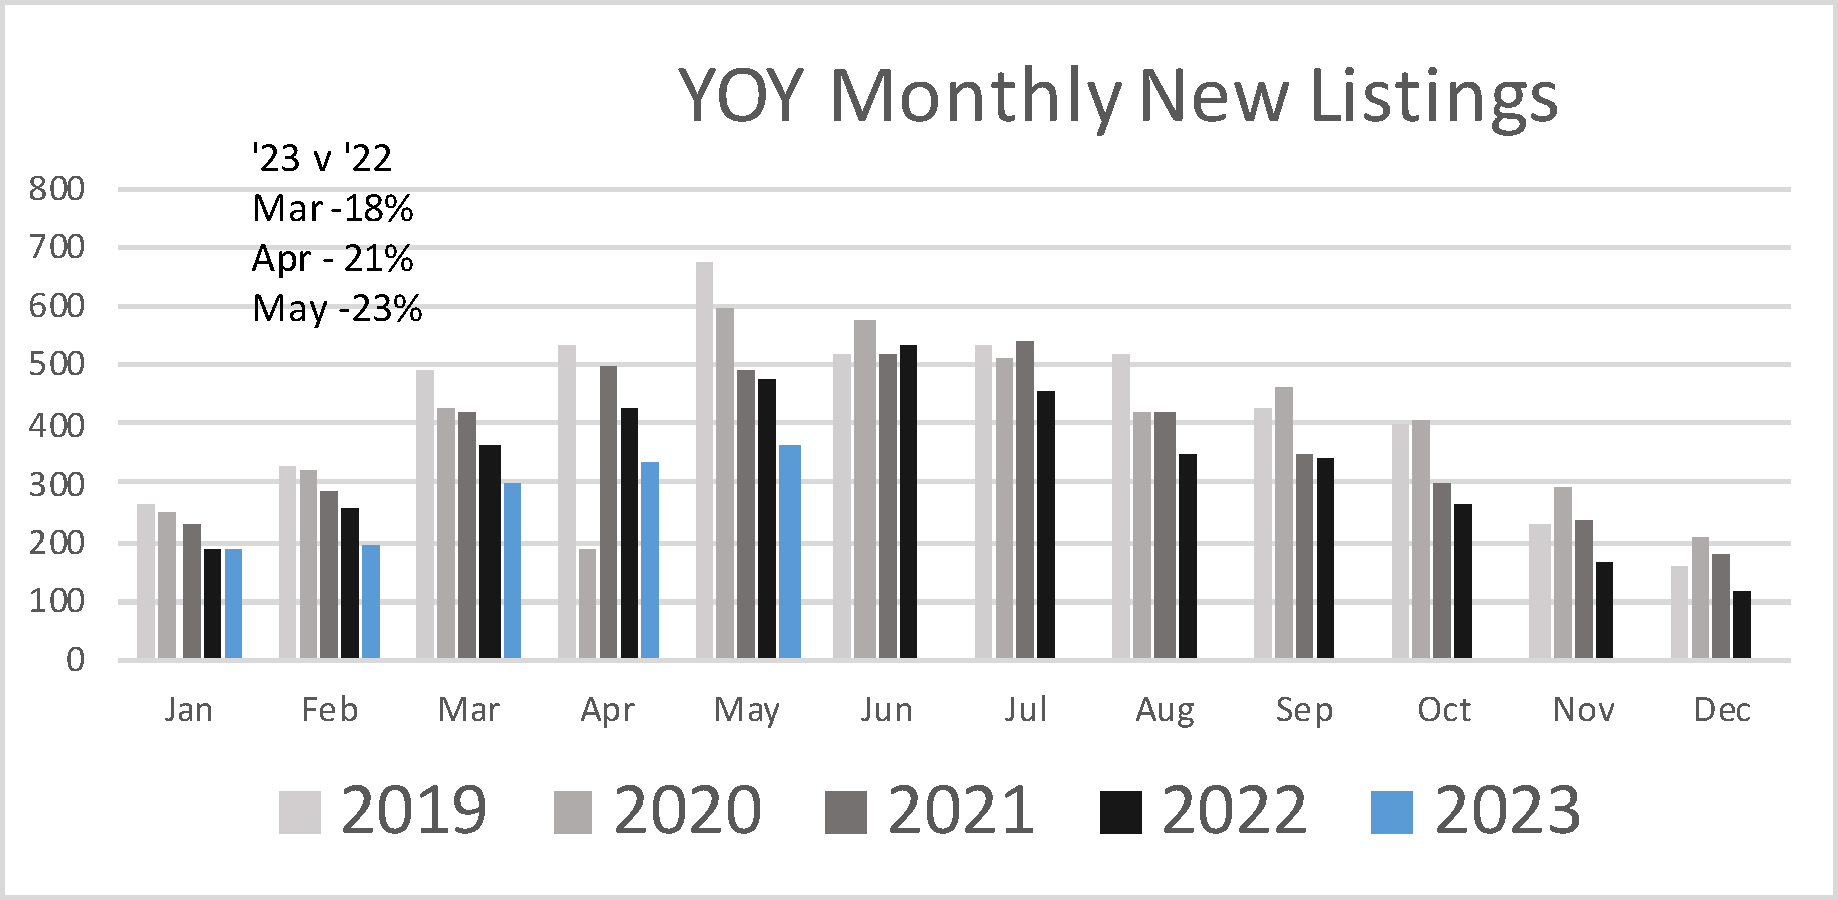
This year’s year-to-date sales decline of 18% is directly associated with a 19% drop in new listings. Buyers remain on the lookout for move in- ready listings, particularly the more affordable ones. In May, there were 364 new single-family homes listed, a decrease from 475 listed in the same month last year.
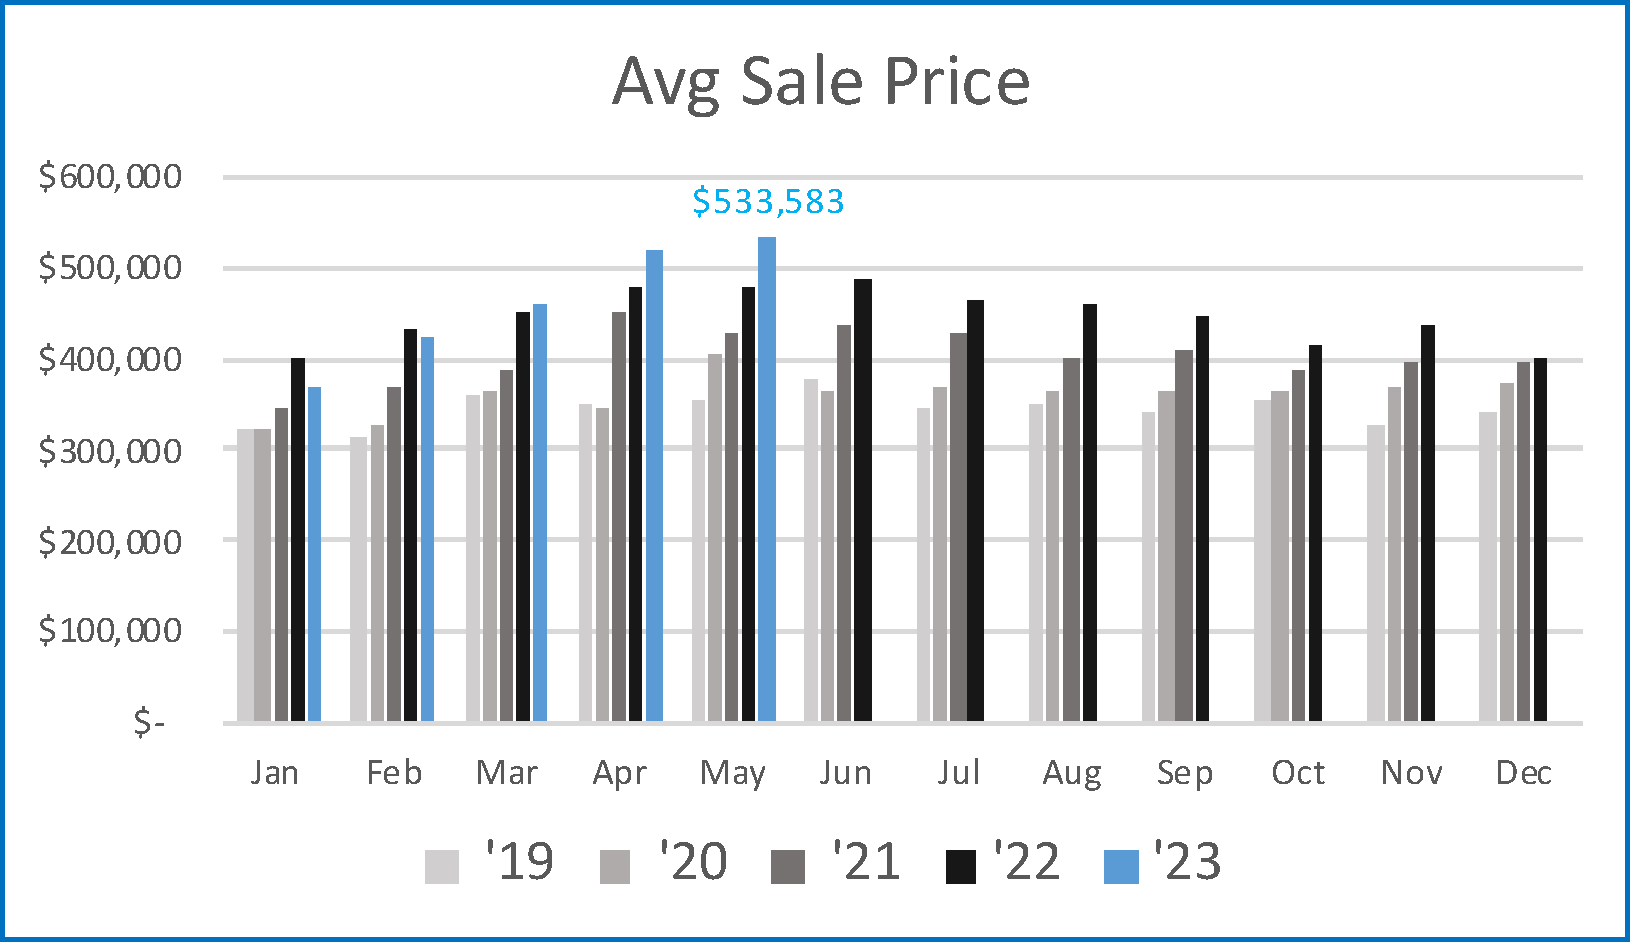
Prices got off to a slow start this year but have hit historic highs in recent months. Average sale prices were down 9% and 2% in January and February. By April and May, they were up 9% and 12% compared to the same months last year. Looking at patterns from prior years and recent growth rates, we expect additional growth in June before seeing numbers plateau or fade a little in July.
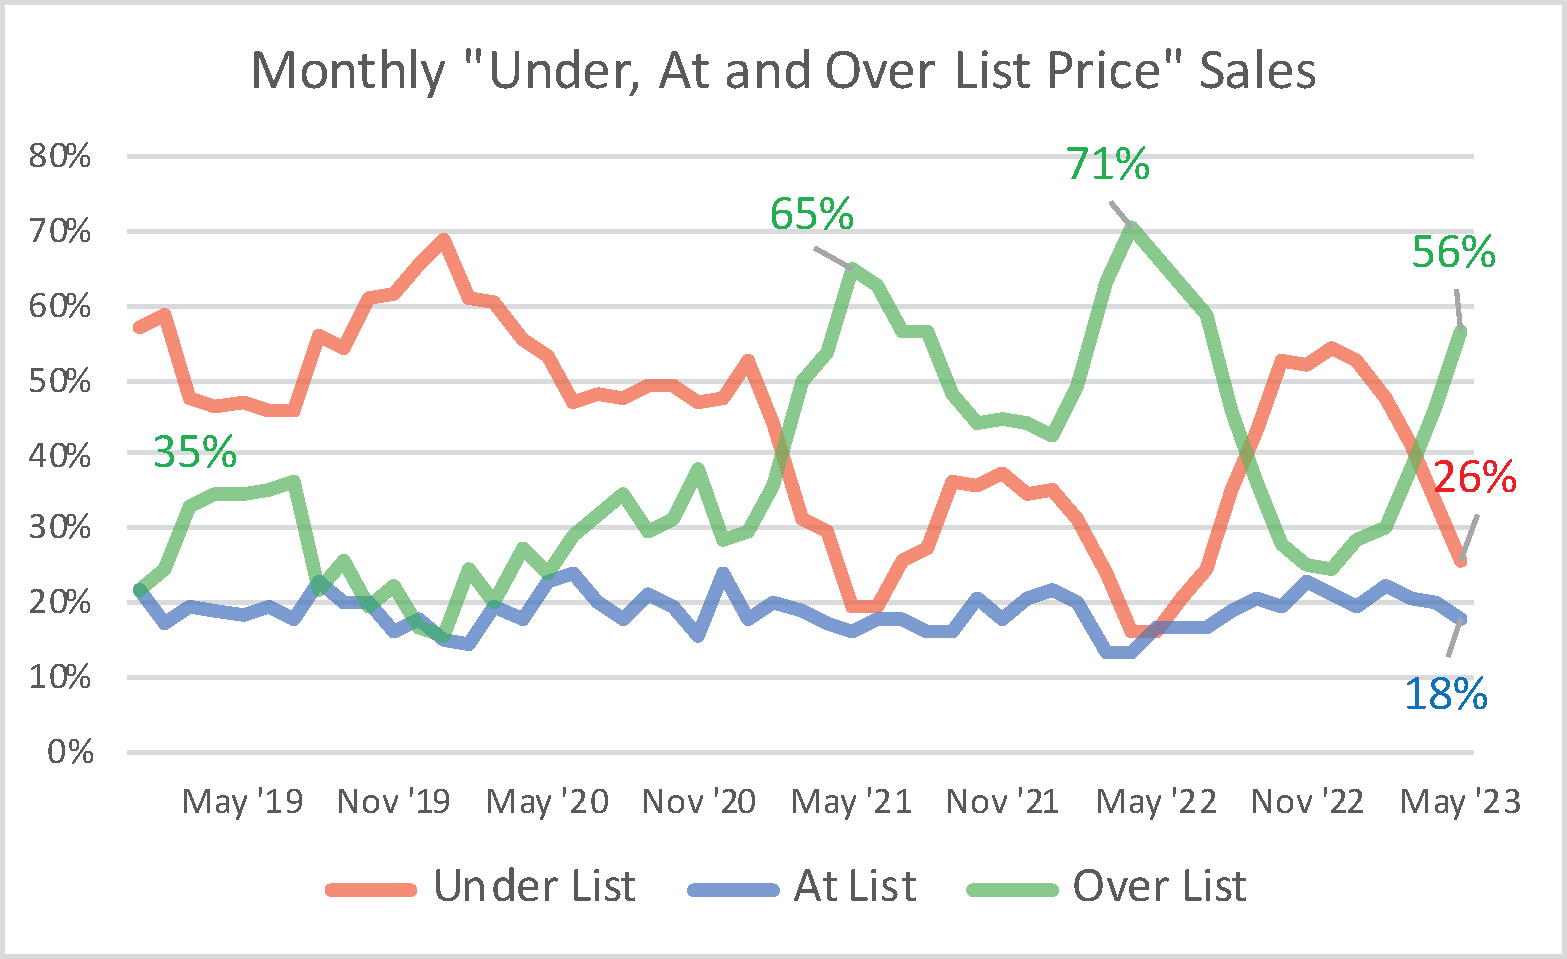
The “under, at, and over list price” chart suggests that the market has another month or two of growth before it begins to fade. In May, 56% of sales closed above the full asking price, while another 18% matched it. Although the over-asking sales in May dipped compared to the intense mid-pandemic figures in 2022 and 2021, they were up 20% over the pre-pandemic percentages. Continued strong demand will keep prices up and stable despite fewer sales.