5 County Condo Summary
Monthly Activity
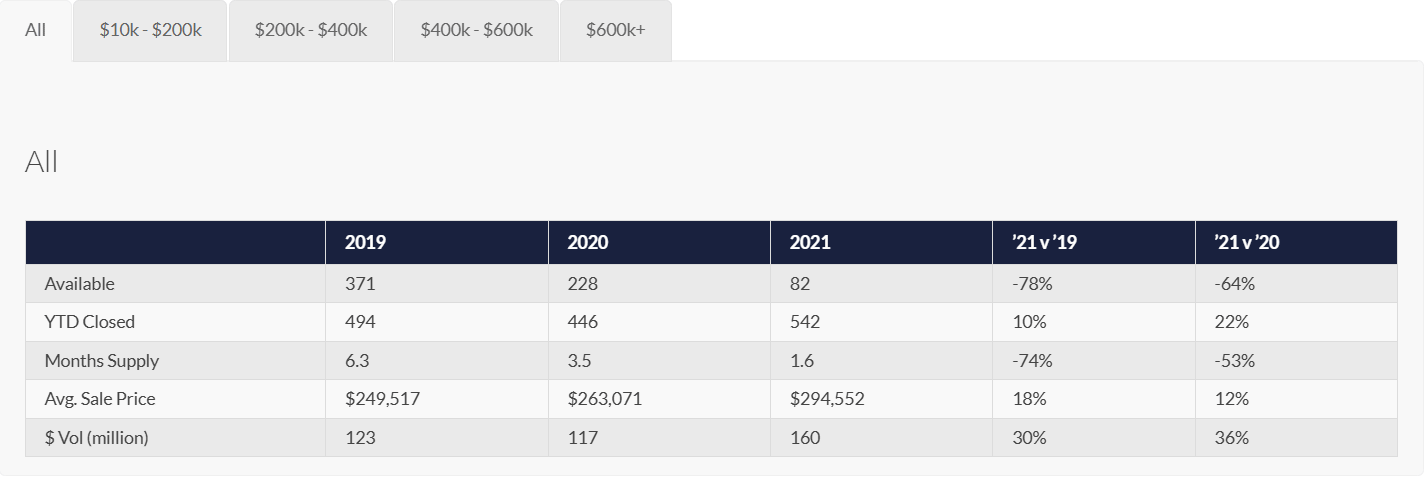
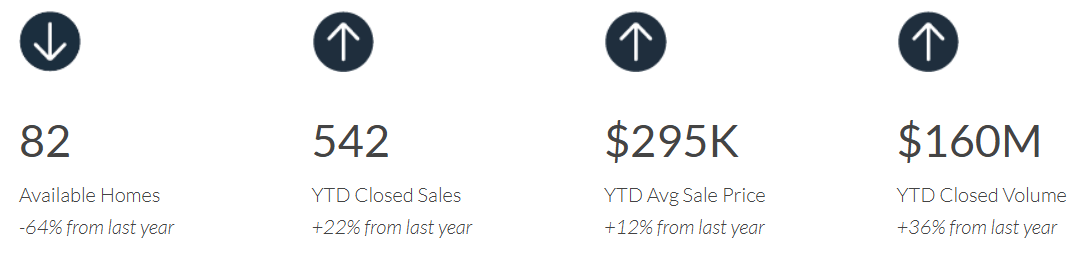
Although supply levels are half of what they were a year ago and a quarter the size of 2019, YTD sales are up 22% and 10% compared to last year and 2019. Average sale price has risen steadily through the year, before peaking in September. While YTD average sale price is up 12%, most of that increase is the result of a change in the mix of sales as opposed to rising values. The number of upper-end sales has doubled in the past year and tripled since 2019. After dipping last year, over-$600k property values have only increased 1% since 2019. Expect year-end activity and prices to settle due to limited inventory and buyer options.
5-County Waterfront Summary
Monthly Activity
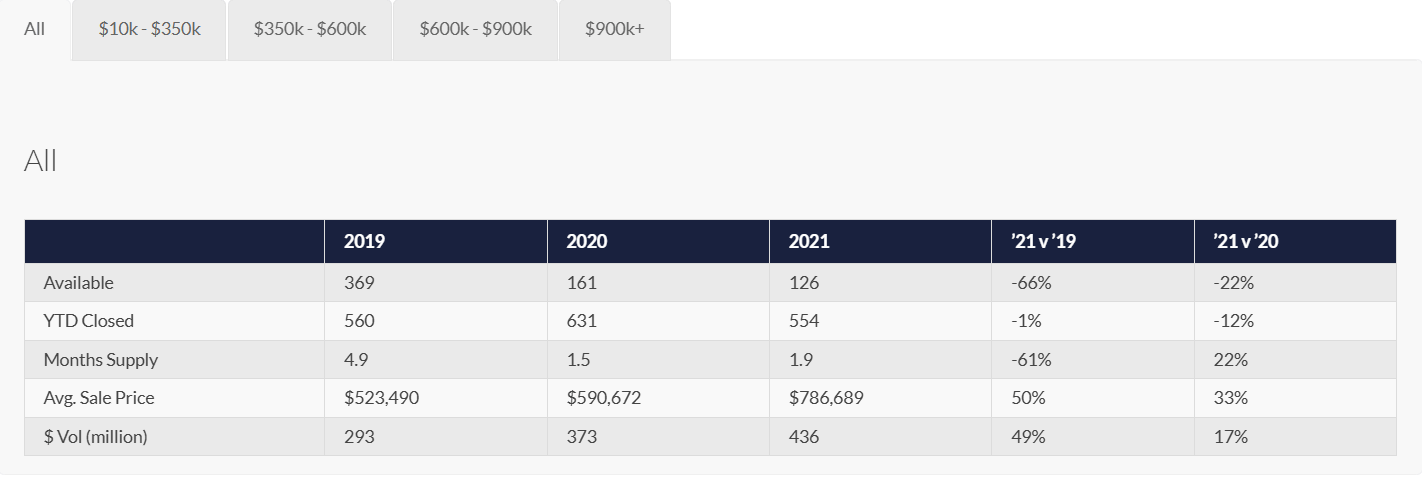
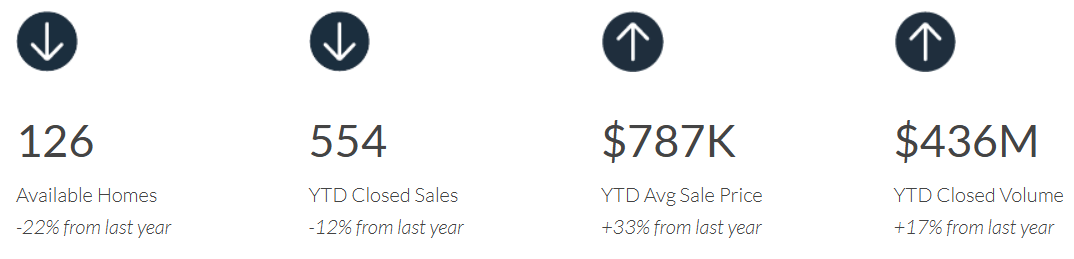
Waterfront sales got off to a fast start early this year. Buyer competition drove up prices as upper-end buyers moved quickly to pick up prime waterfront properties—April’s average sale price was just shy of a million dollars. Sold units temporarily peaked in May and June with more of the mid-priced properties in the mix. Since July, the average sale price has been hovering around $800k. Both the upper and lower ends of the market have seen the most appreciation with prices up about 20% in the past year and about 30% since 2019. In the past year, the $350-$600k market has had modest appreciation.
5-County Non-Waterfront Summary
Monthly Activity
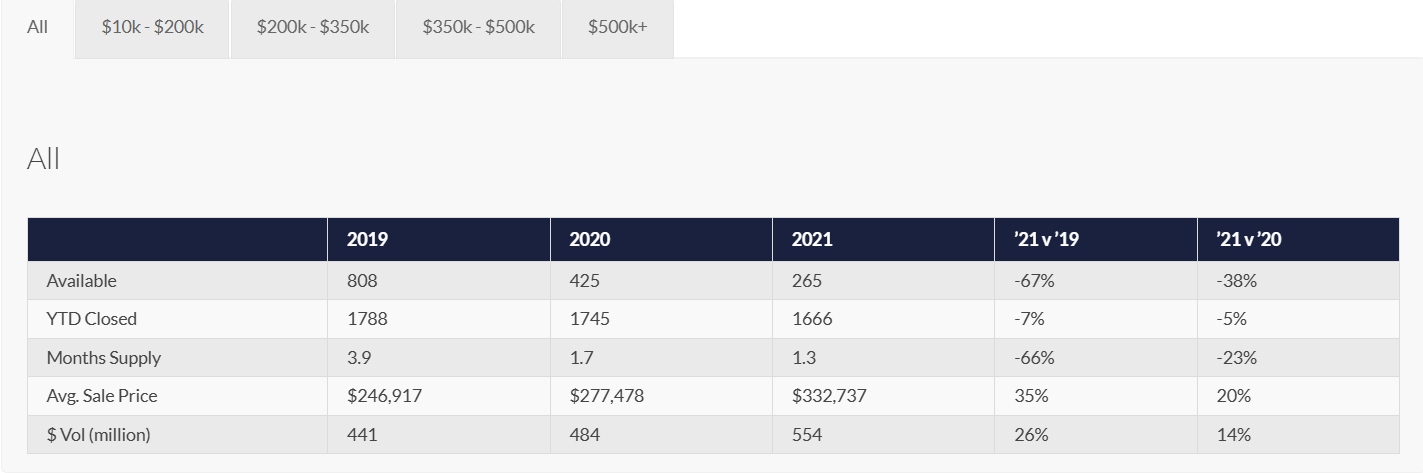
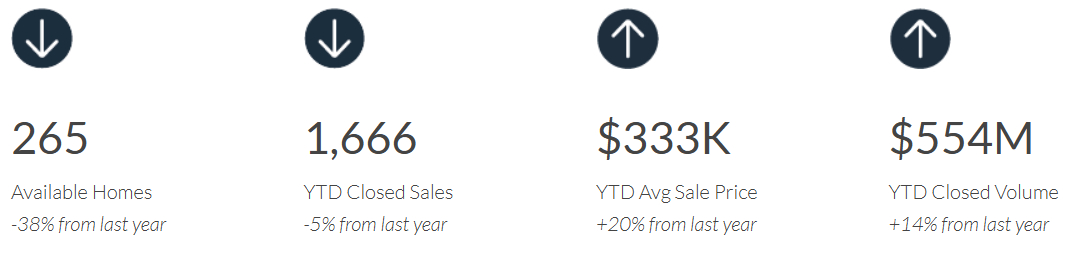
While prices have been on a steady rise, non-waterfront properties have not had the same jump in sales activity that they had in the third and fourth quarters of last year. YTD closed sales are down 5% and 7% compared to last year and 2019. Average price peaked in July at $360k before slightly tailing off—it fell just shy of $350k in October. In the past year, the middle price ranges have had appreciation rates of approximately 20% while the upper and lower price ranges have been slightly below 10%. Through the balance of the year, expect both sales and prices to temporarily dip as the market normalizes and seasonality returns.