
Recent Rate of Sales:
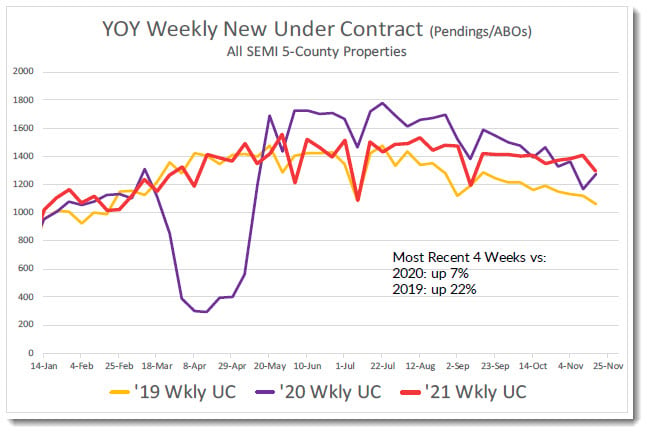
The chart below tracks the weekly number of listings that went under contract for each week since January 2019. While the ‘20 line shows a strong bounce with high numbers of third quarter sales that faded in the fourth quarter, the ‘21 line has been more consistent and has less of a fourth quarter fade. In the past four weeks, sales and new under contract homes have been up 7% compared to last year and 22% compared to the pre-pandemic 2019 baseline.
Value Trends:
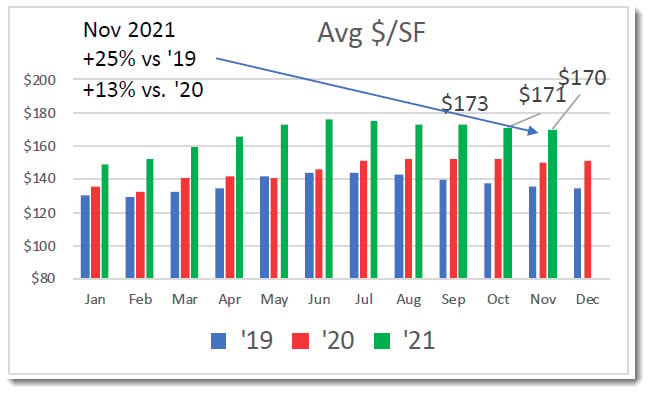
While there is variation within price ranges, monthly price per square foot peaked in June at $178 and has been slowly declining since—$170 in November.
Market Times:
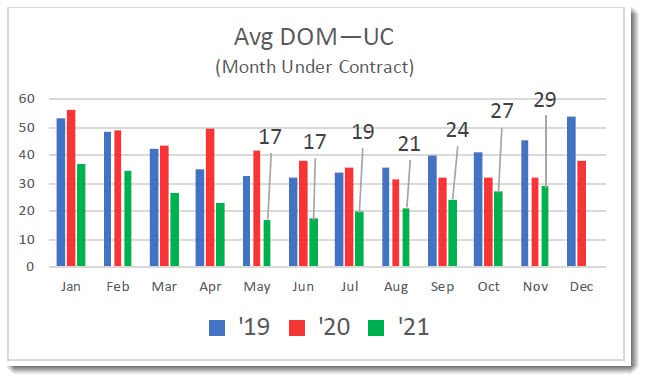
Average days on market bottomed out in May and June at 17 days and has been rising since—29 days in October.
Outlook:
As the market normalizes and seasonality returns, expect buyer demand and prices to temporarily fade while market times increase through the year end and early 2022. Prices will continue to rise in 2022, but at a slower rate. Although the number of upper-end sales will continue to increase, those values will be flat compared to lower and middle price ranges.