
While seasonal cycles repeat, sales activity can vary dramatically by price range even within the same market area. Monitoring showing activity using InfoSparks and tools provided by ShowingTime can help agents predict what lies ahead for their clients.
To provide an example, Oakland County has been divided into low, medium and high price ranges—under $200k (blue), $200k to $600k (red), and over $600k (gray).
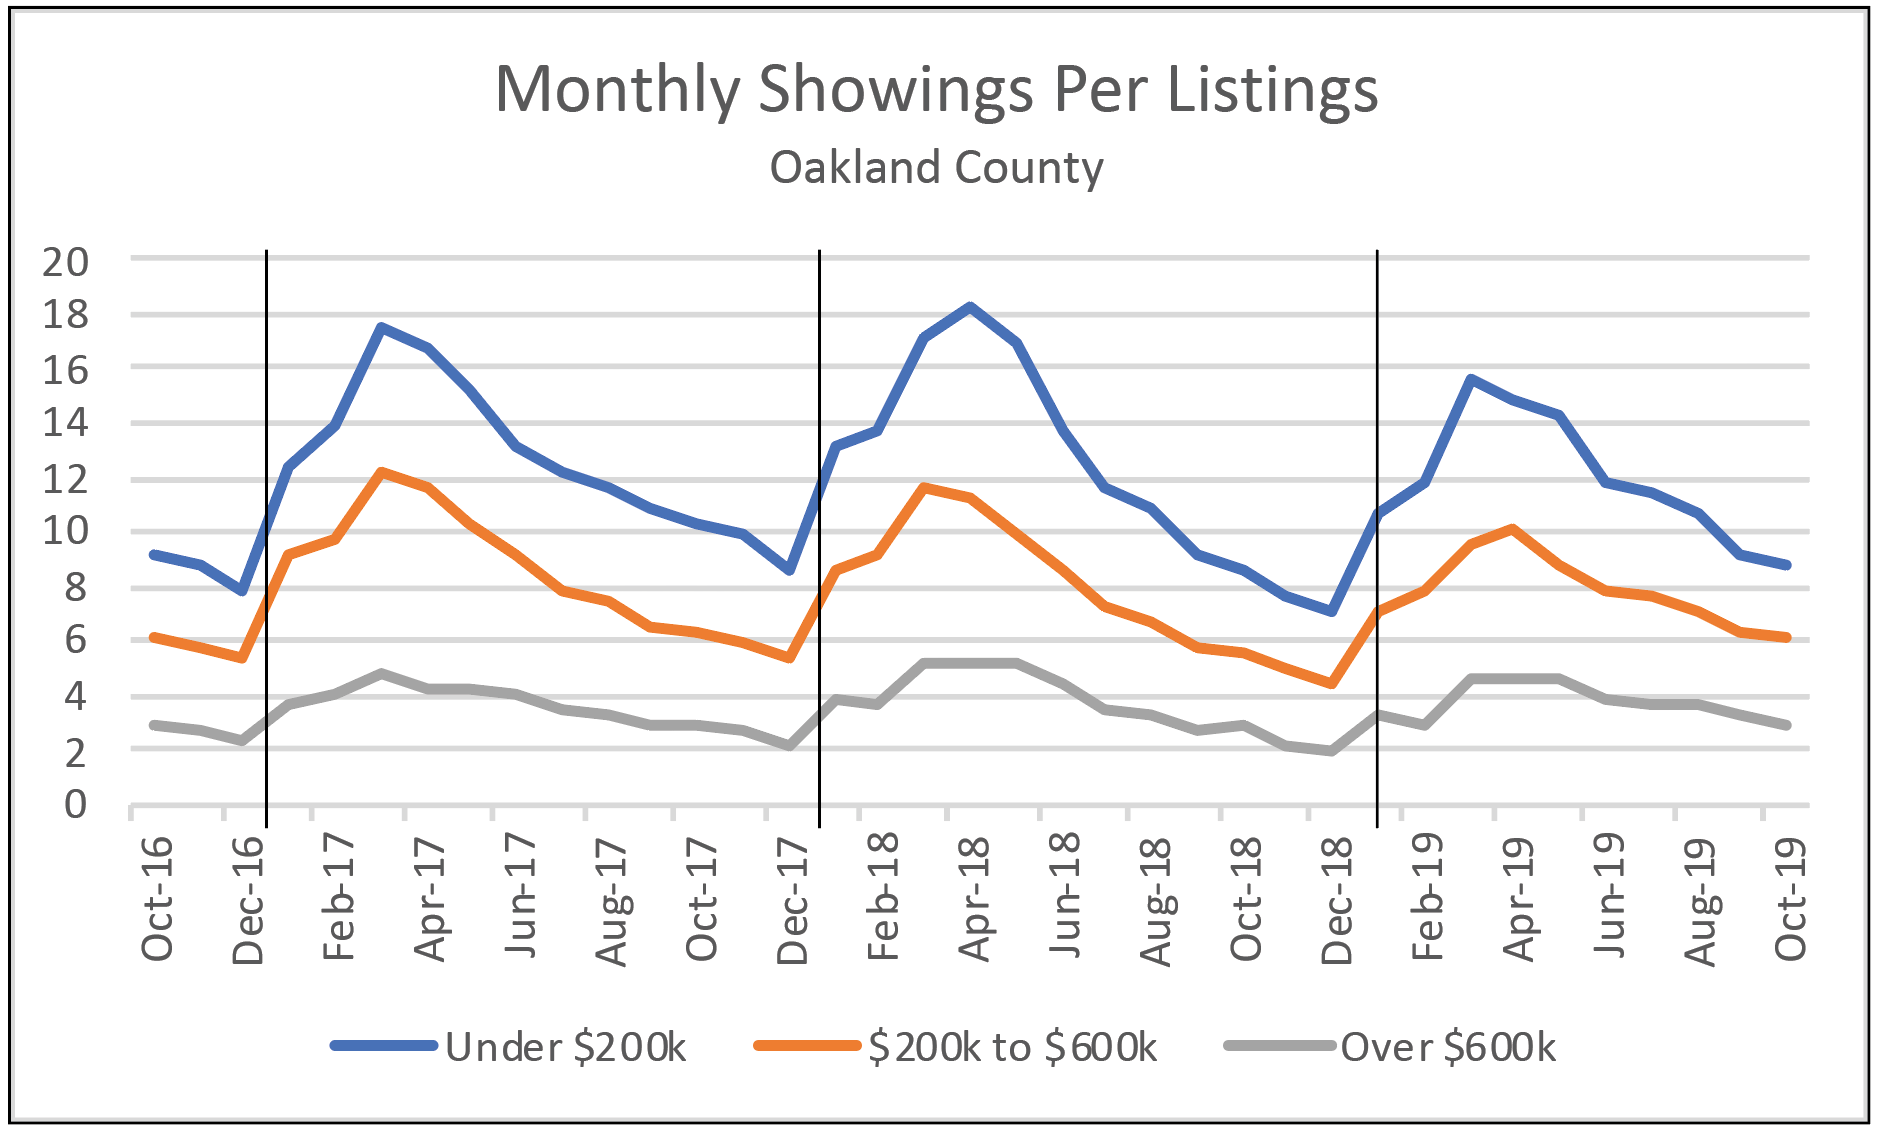
Monthly Showings Per Listing
Showing activity typically ramps up quickly early in the year. It peaks around April and slowly tails off through the balance of the year. This year, listings priced below $200k averaged 15 showings in April compared to 9 in October. Homes priced between $200k and $600k went from a high of 10 down to 6, and listings priced over $600k moved from 5 in April down to 3 in October.
Showings to Pending
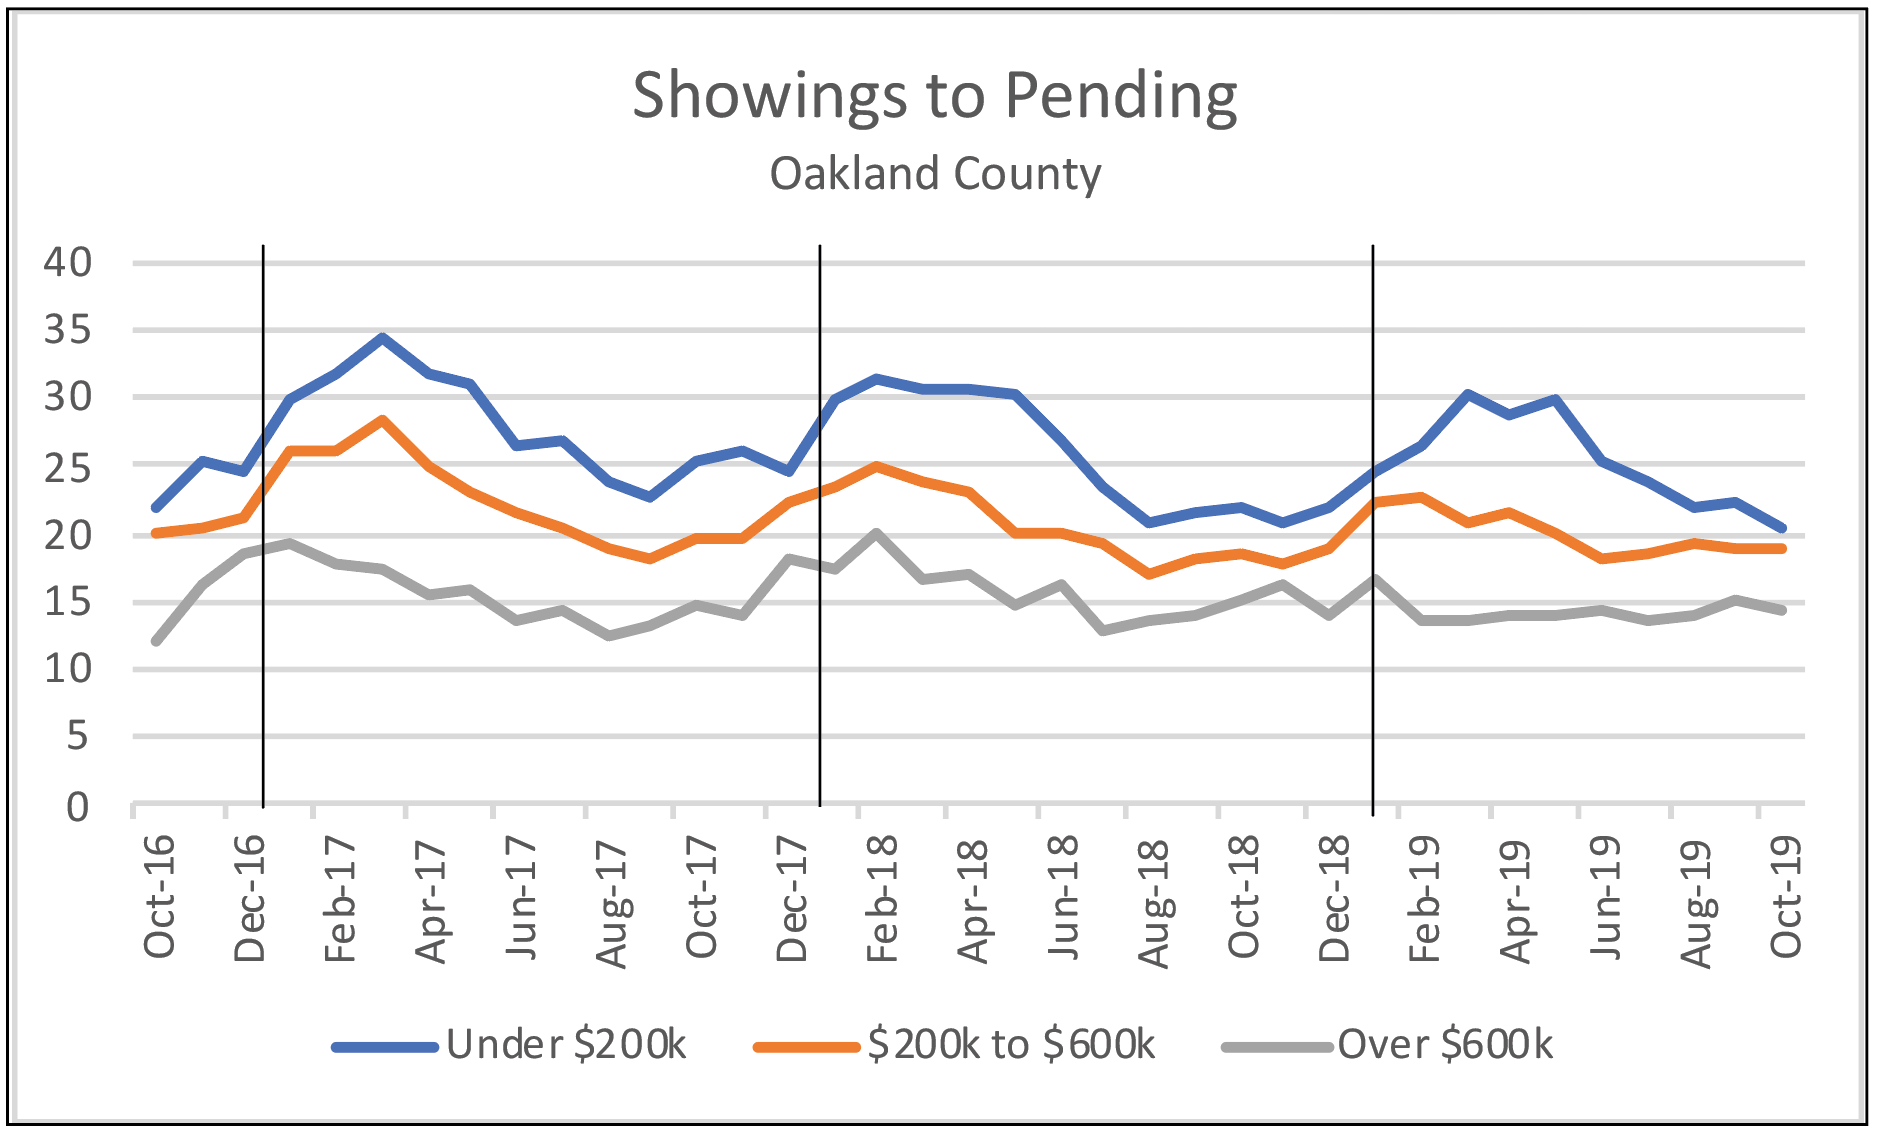
While upper-end homes don’t receive as many showings as lower and middle-priced homes, it typically takes fewer showings for them to sell. There has been a general perception that this year’s market has been slower than recent years. While sales in Oakland County are just shy of last year’s pace, this chart shows that the homes that are selling require fewer showings than in the previous two years. Buyers continue to jump on the best move-in-ready homes in all price ranges.
Closed Sales Per Month
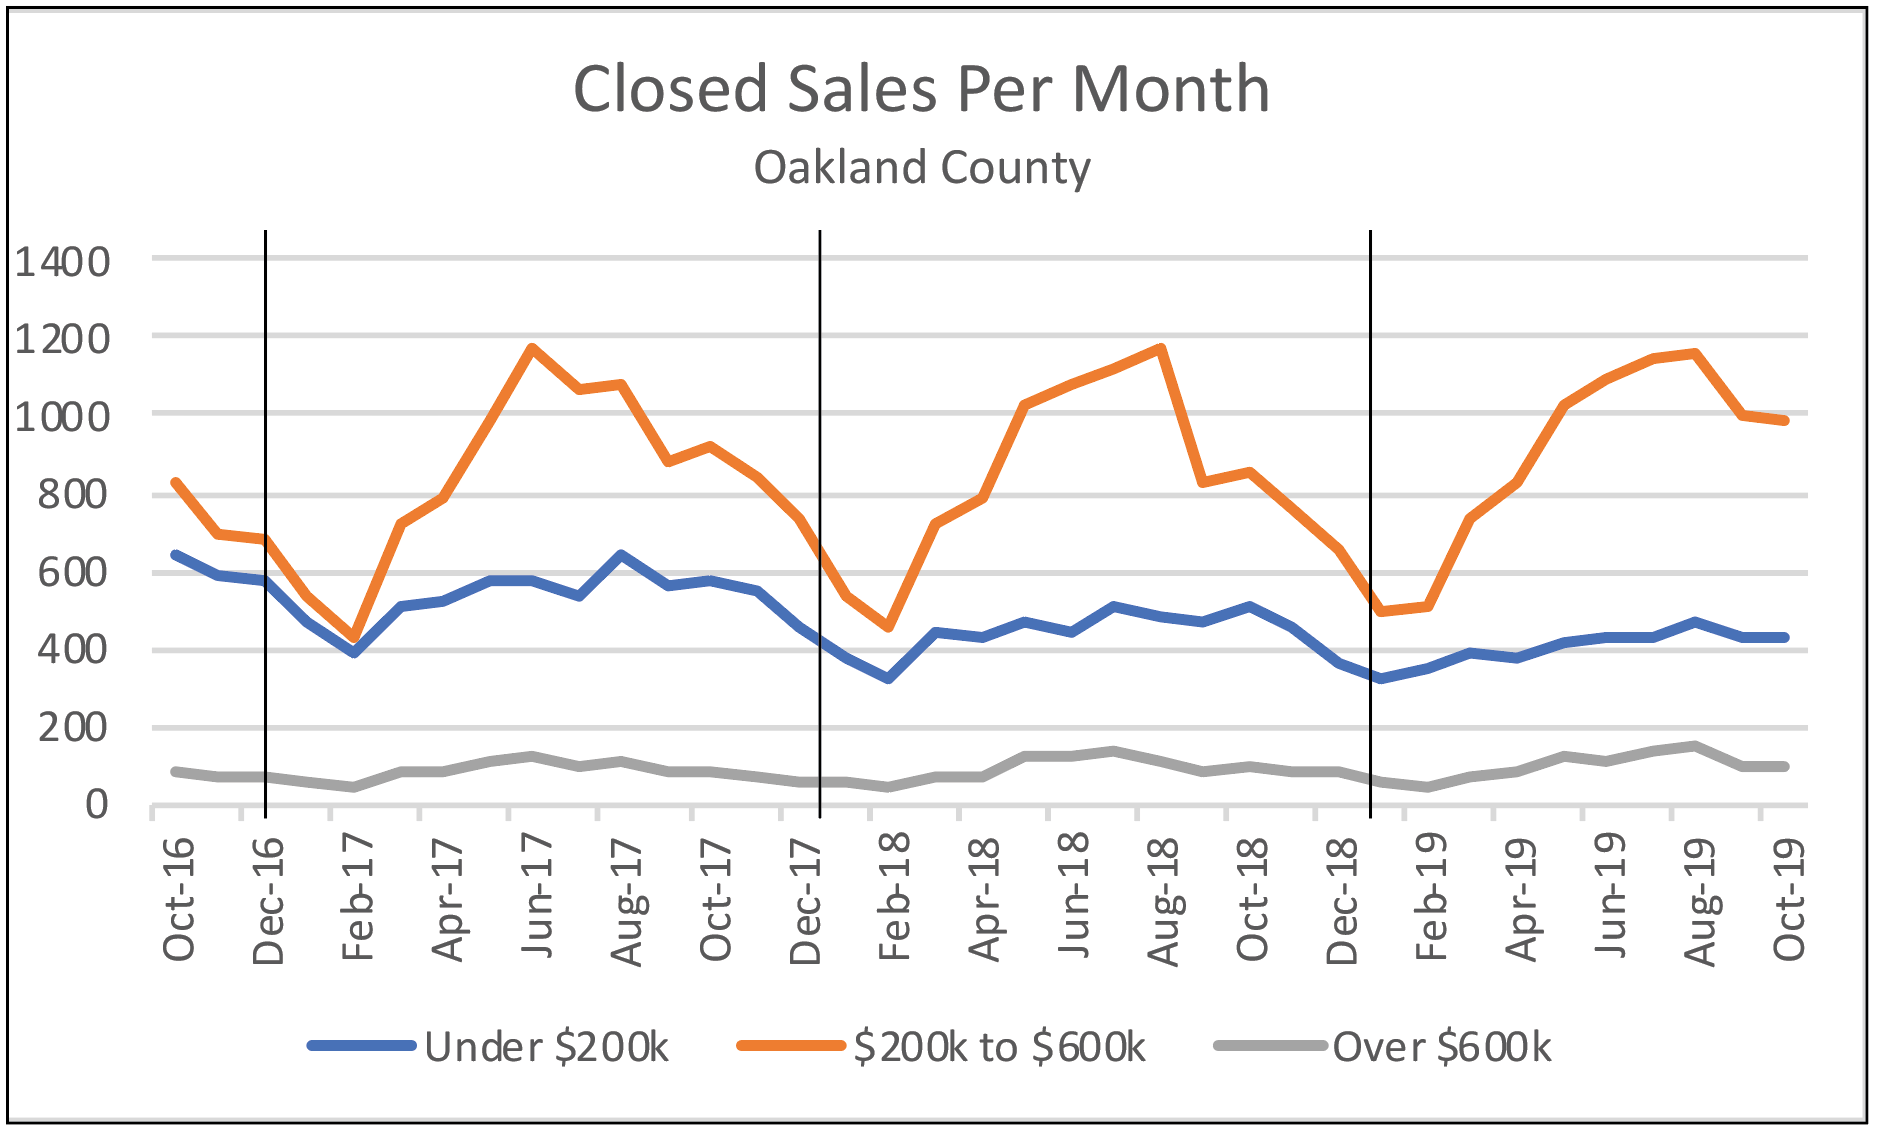
The middle price ranges are most affected by seasonality when looking at closed sales. Seasonal factors don’t appear to affect entry and upper-end markets as much. Notice that in the middle market, closed sales peak about 3 or 4 months behind monthly showing activity and that the shape of the curves looks similar. For sellers in the middle price ranges, monitoring showing activity provides valuable insight as to wh.