Summary
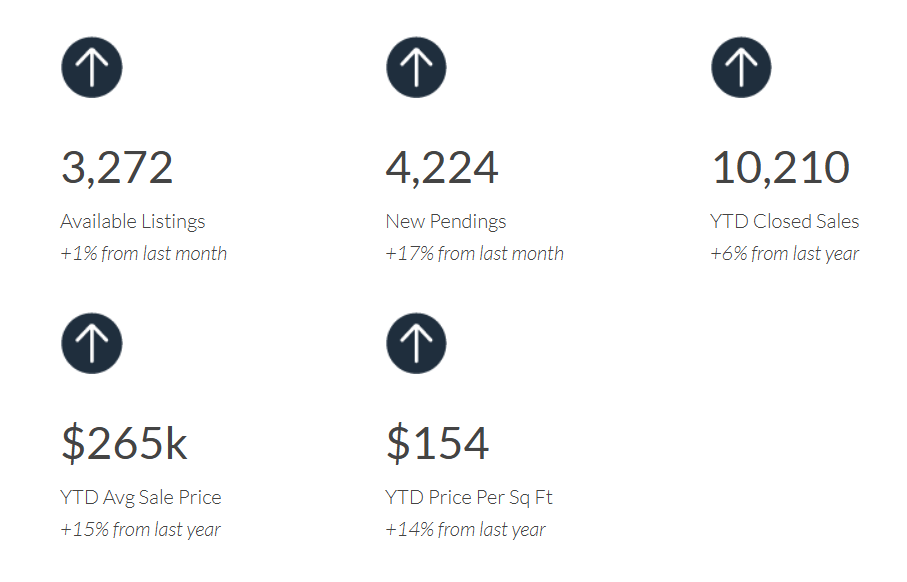
While they appear to be bottoming out, current inventory levels are down 57% compared to the same time last year and 64% compared to 2019. New listings have begun to outpace new pendings by a slim margin. As a result, available listings are up 1% from a month ago. Through March, YOY closed sales were up 6%. Prices continue to rise with average sale price and price per square foot both up—15% and 14%. About half of those increases are due to the sales mix which contains fewer entry-level sales (lack of inventory) and more upper-end sales. Pay attention to the $/SF change for individual price ranges in the right column of the lower table below—up 8% to 10% for under-$500k sales and 4% for over $500k sales.