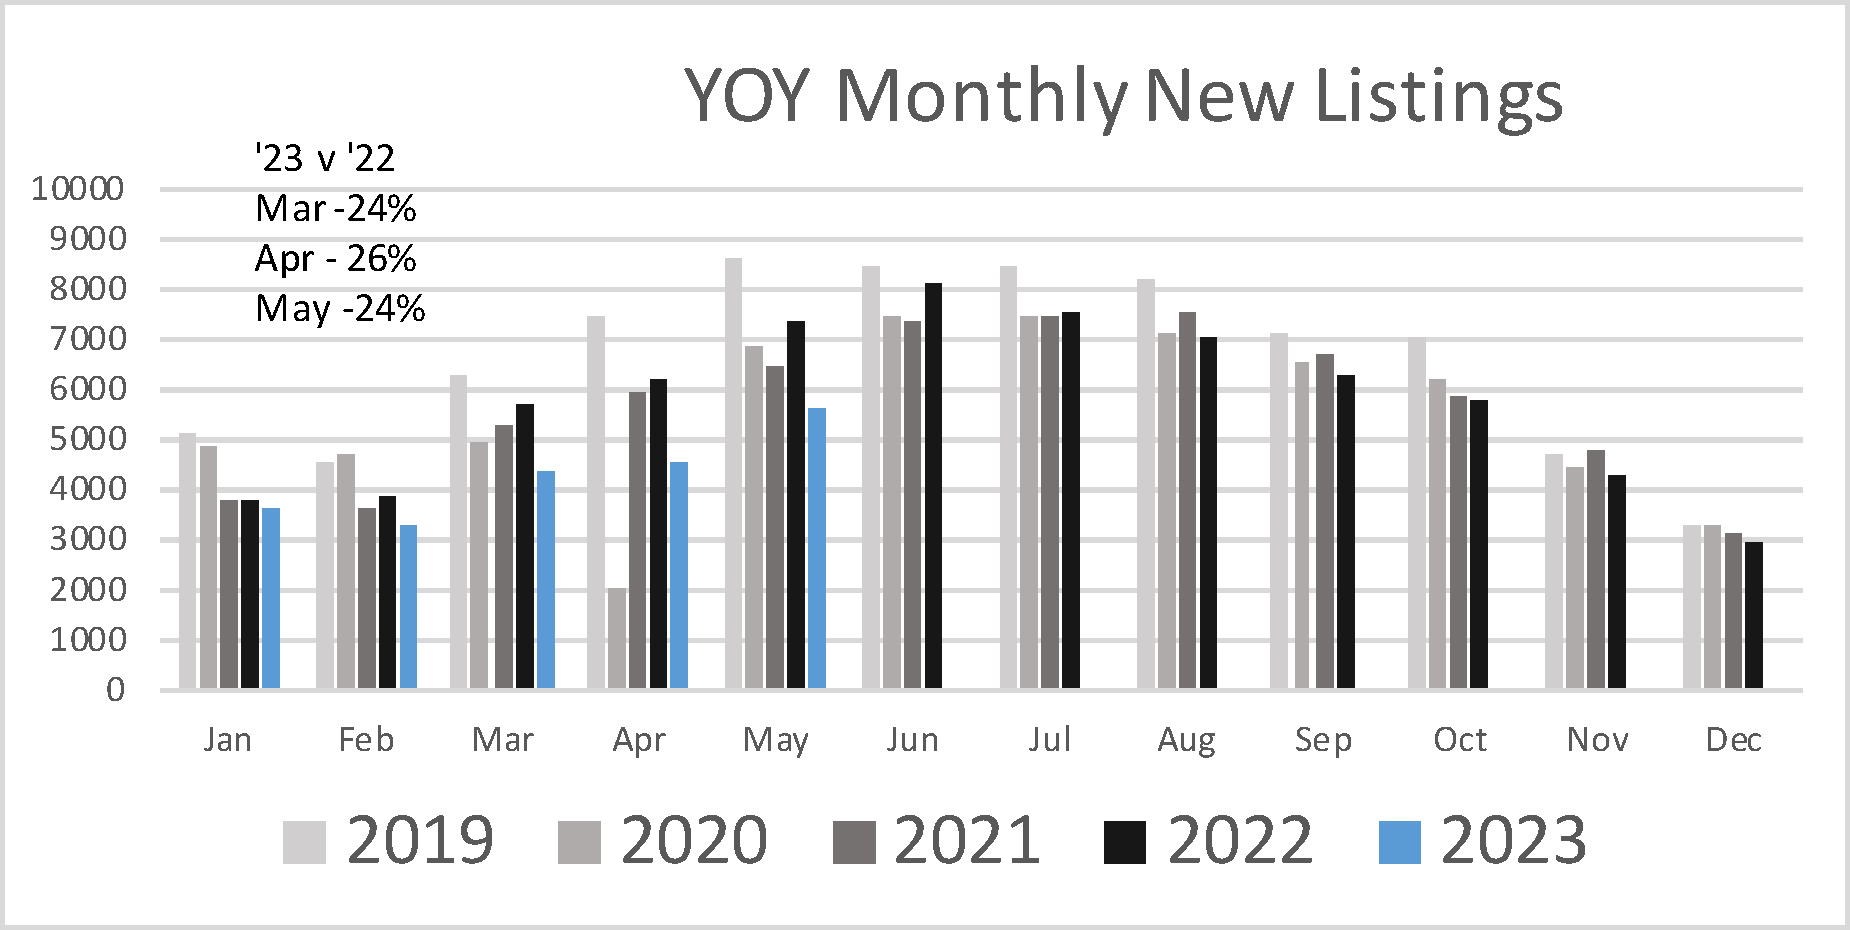
This year’s 20% YTD decline in sales is directly linked to the scarcity of new listings—down 21% YTD and slightly more in recent months. Buyers continue to wait for move-in-ready listings, especially in the more affordable price ranges. In May, we saw 24% fewer homes listed compared to the same time last year, a decrease of 1,741 homes. Current demand consistently exceeds available supply.
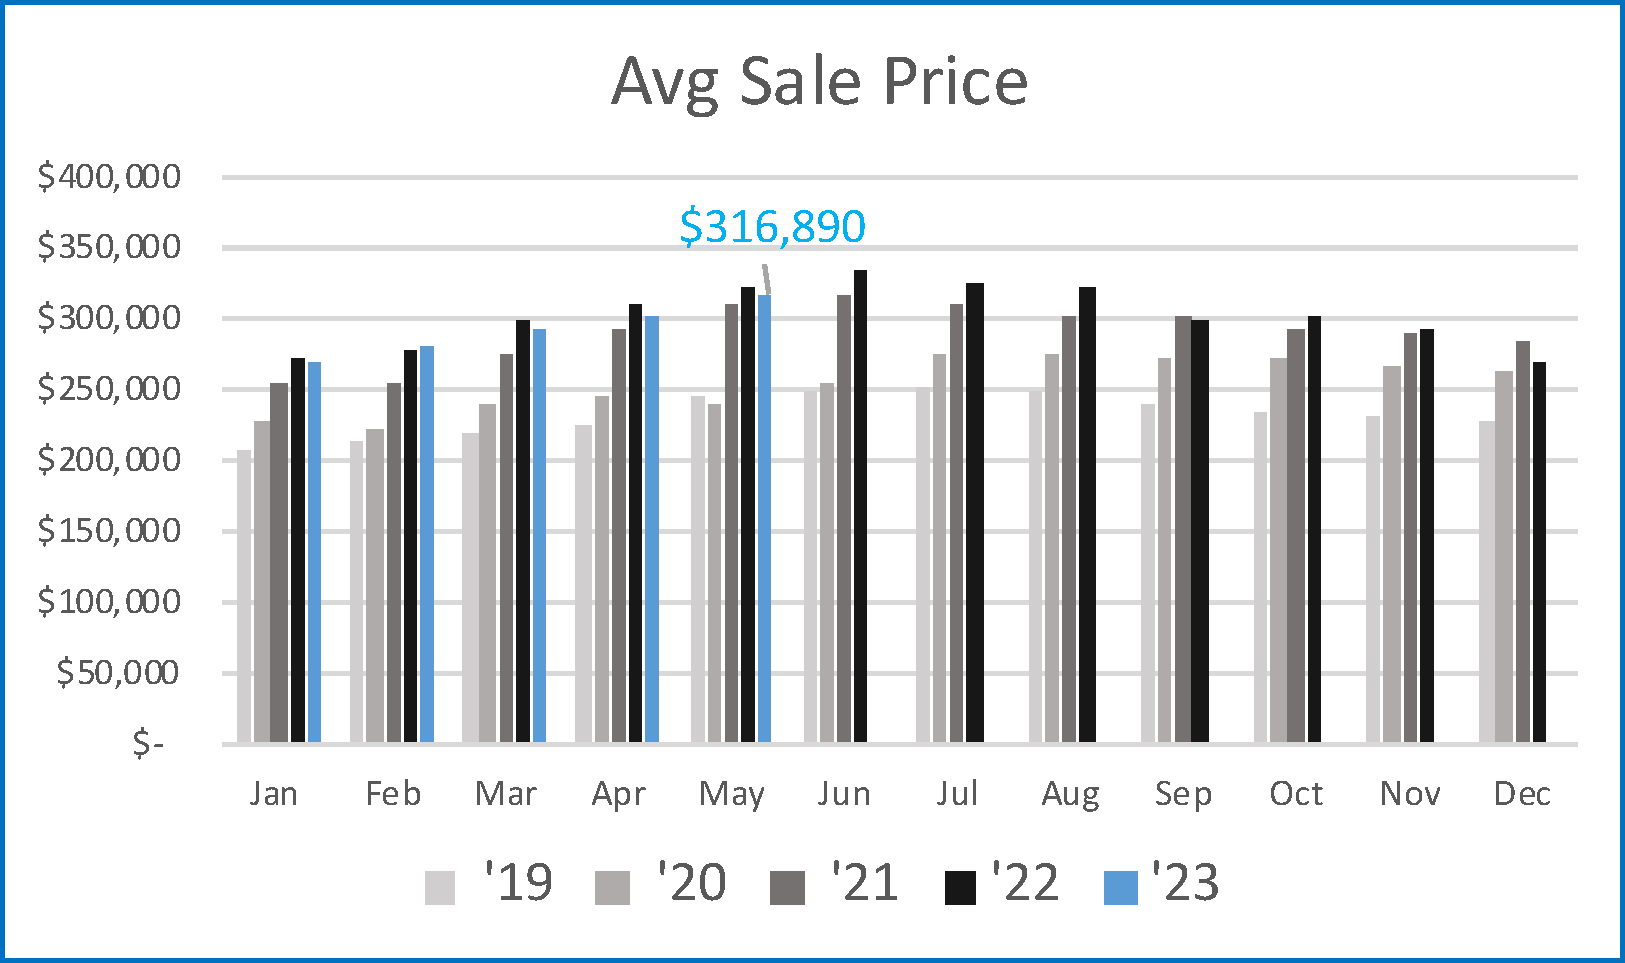
While the market lacks last year’s intensity, the best listings continue to sell quickly. The slight increase in February may have been a reaction to a temporary dip in interest rates. New pendings also ticked up at that time.
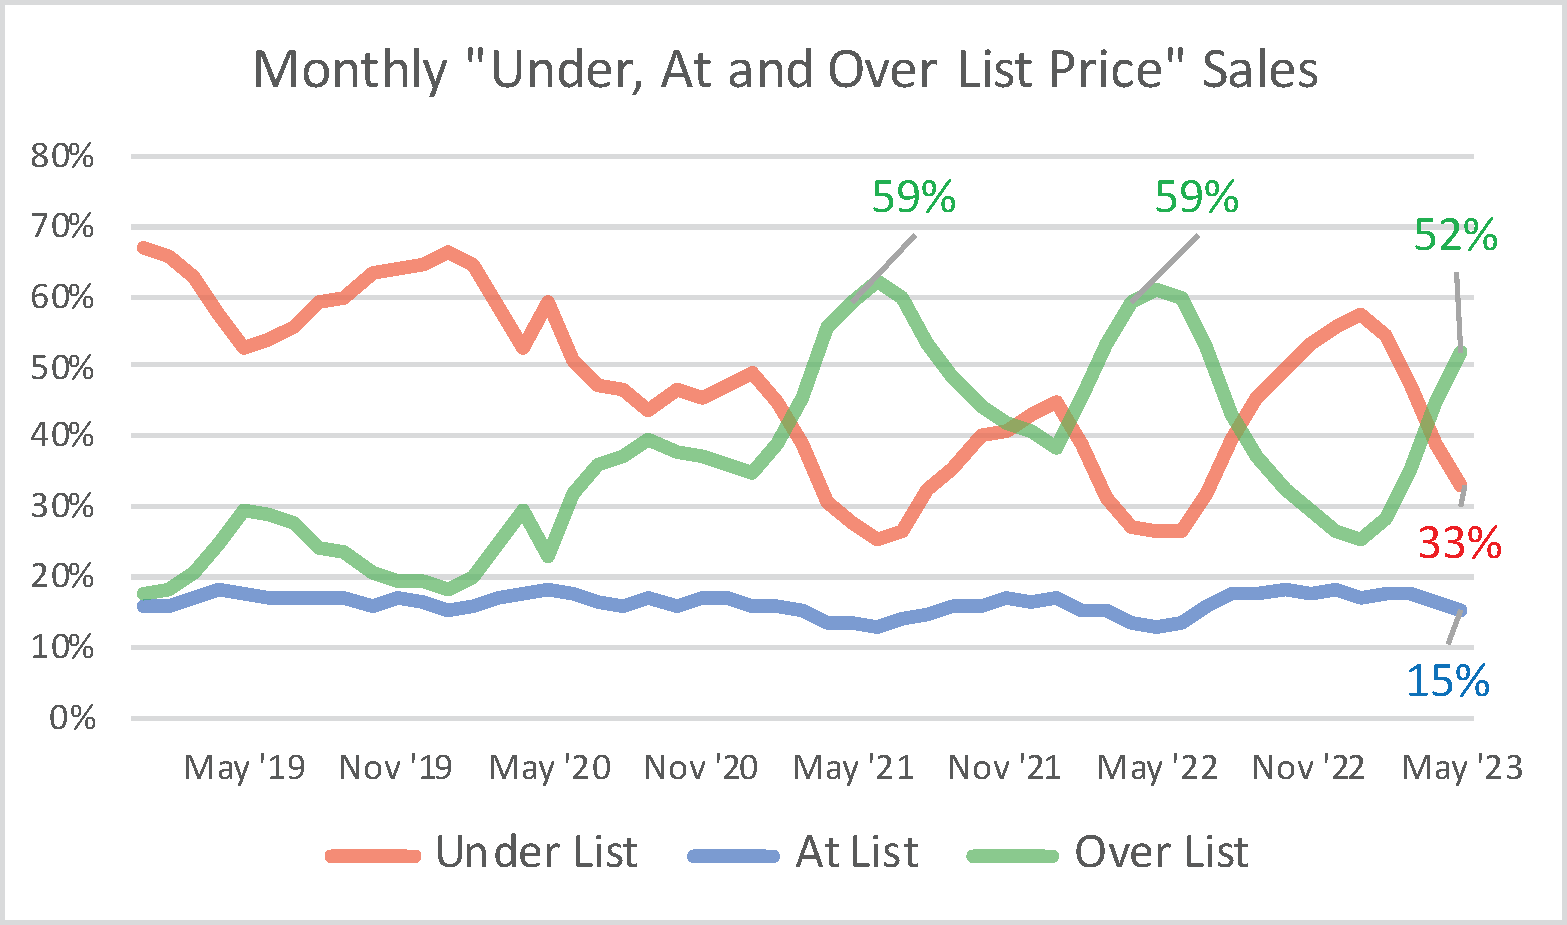
Thirty-seven percent of March closed sales were above full asking price, 21% were at asking and 43% were under. As shown in the “Under, At and Over” chart, the “Over” sales are increasing while the “Under” sales are decreasing. Expect the Over-Asking percentage and market intensity to peak just before summer as it has done the past two years.