Summary
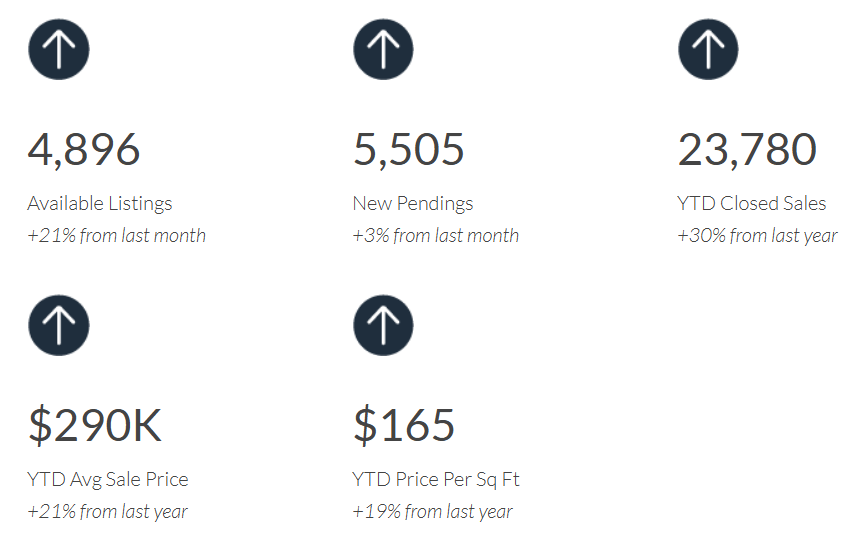
The market continues to rally with inventory, new pendings, closed sales and values all up compared to prior months. Available listings rose 21% and pendings 3% compared to last month. Despite recent increases, listings are down 36% from a year ago and half of what they were in 2019. Showings and new pendings provide an early indication of future closings—both remain strong with recent showings up 11% compared to 2019 when inventory levels were double what they are now. Look for prices to continue to rise. As seen in the chart above, average price per square foot has increased from $150 in January to $178 in June. Within the price bands shown below, YTD values of mid-price homes are up 10-13% and 8% for the high and low bands.