Summary
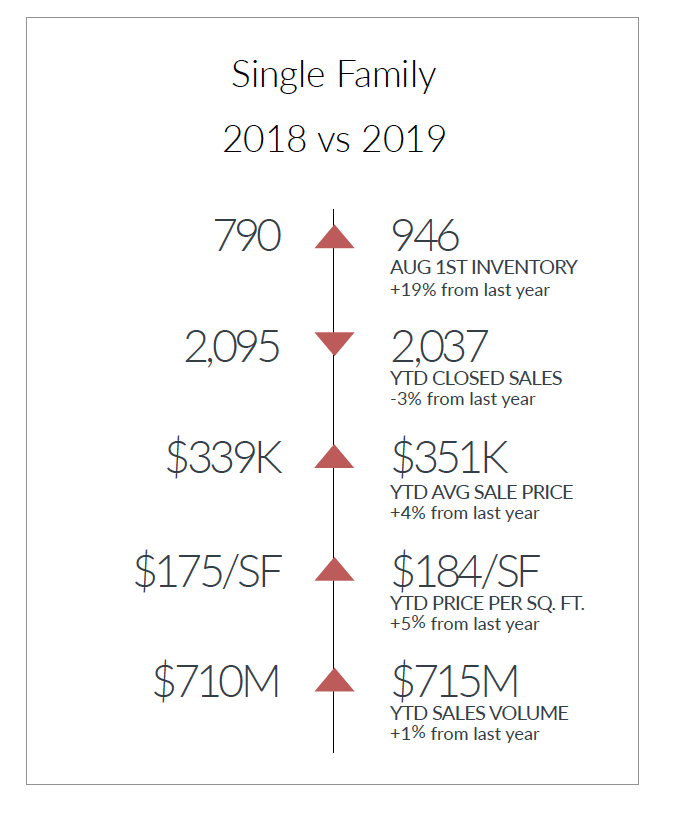
Inventory—Available listings are up slightly compared to last month, and up 19% compared to this time last year.
Closed Units—Closed sales dropped 3% compared to last month and 4% YTD. That slight drop in July closed sales is common.
Values—Price per square foot dipped slightly in July, but YTD average sale price and price per square foot are up 4% and 5% respectively.
Summary—While sales of homes priced under $400k continue to decline, upper-end markets continue to grow and values of upper-end properties continue to rise. Closed price per square foot for $400-800k homes is up 6% and up 16% for over-$800k properties. In most other Michigan metro markets, upper-end values have been leveling or declining.
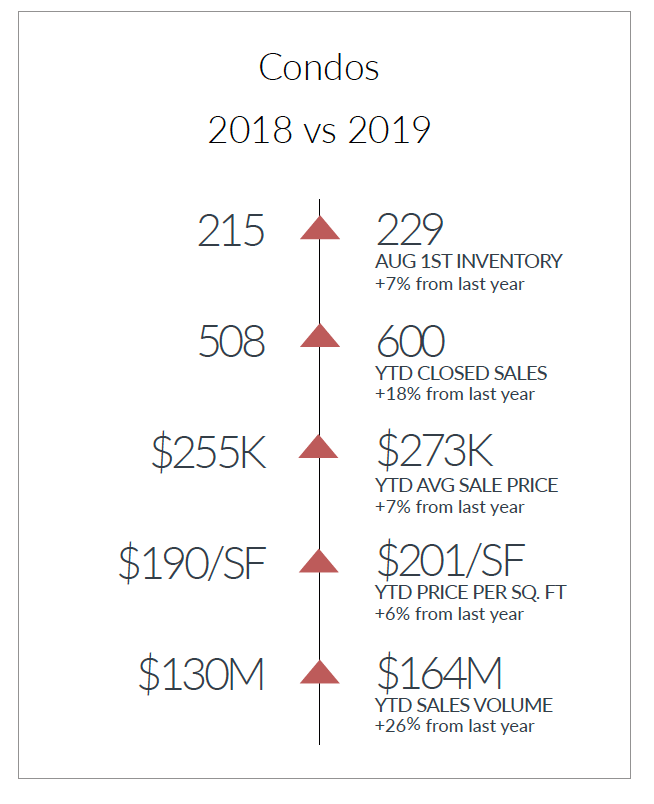
Inventory—Condo listing inventory has been holding relatively steady—up 3% from last month and 7% compared to the same time last year.
Closed Units—The 122 July closed sales were up by 9 units from the prior month. The 600 YTD figure is up by 92 from a year ago.
Values—Price per square foot slipped slightly last month, but it’s up 6% YTD average sale price is up 7%. Averages have been driven up by the number of over-$400k sales nearly doubling, yet, the average price per square foot for these high-priced units is down 11% compared to last year.
Summary—YTD over-$400k sales jumped from 52 last year to 102—driving closed volume up by $34M. Keep an eye on upper-end values. Despite the additional sales, YTD average price per square dropped from $317 to $281.