Summary
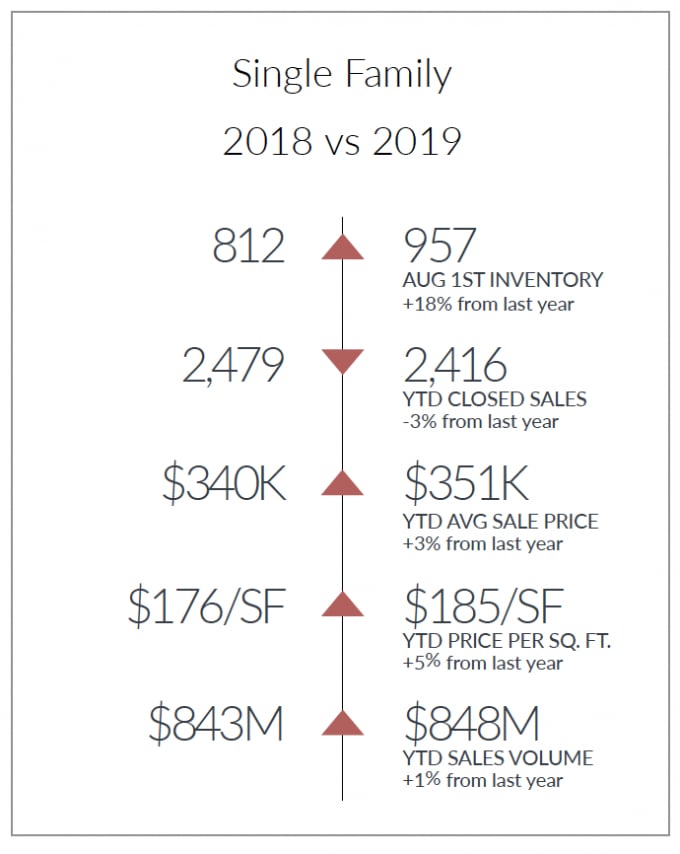
Inventory—Although inventory is nearly level with last month, it’s 18% higher than it was a year ago.
Closed Units—Closed sales peaked in June and have declined each of the past two months—that’s typical. YTD sales are down 3% compared to last year.
Values—Prices continue to rise. YTD average sale price moved from $340k last year to $351k and average price per square foot went from $176 to $185. The upper end market (over $600k) saw the biggest increase in both sales and values.
Summary—Although closed sales are two months into their season decline and the YTD figure is down 3%, moderate price increases have YTD volume higher than it has ever been—nudging out last year by 1% and 2017 by 3%. The upper-end market segment continues to expand with the biggest increase in both sales and value.
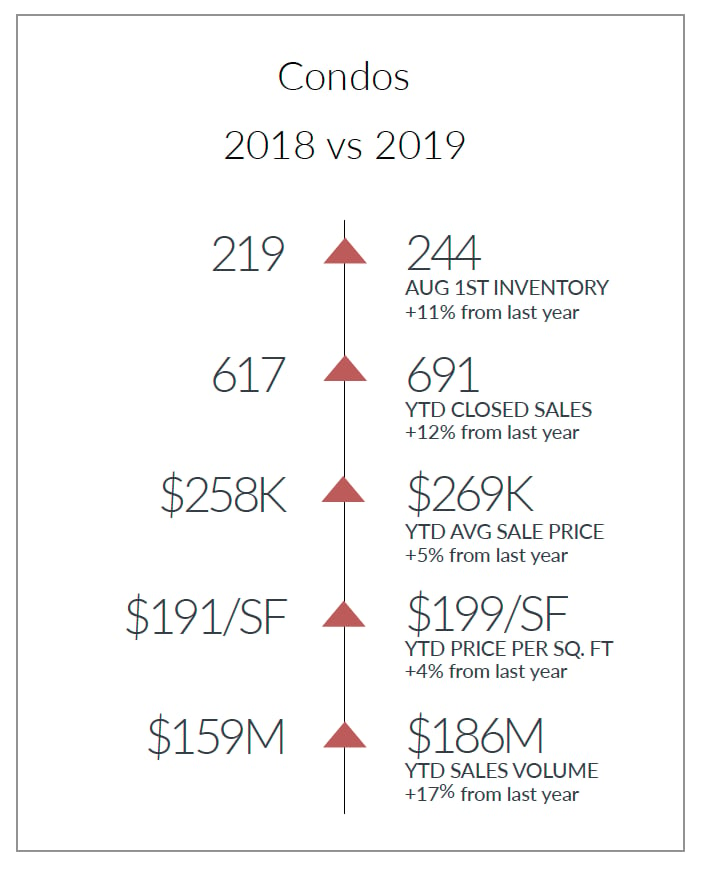
Inventory—Available listings are up 7% from last month and 11% from September 1st last year.
Closed Units—Although August sales dropped 27% from the prior month, YTD Sales are up 12% from a year ago.
Values—YTD average sale price rose 5% from $258k last year to $269k. While price per square foot was up between 3% and 5% in all other price ranges, it fell by 11% for condos, which sold for over $400k.
Summary—While the rest of the market continues to trend as it has in the past, new development has been changing the upper-end market. Despite the YTD number of over-$400k sales jumping from 69 last year to 114, price per square foot for those units dropped from $315 to $280. Since 2017, the number of over-$400k sales doubled but price per square foot for those sales fell from$356 to $280. Market times have also increased from 86 to 125 days.